Self-Hosted Blog Part 9 - Performance
In part 8 we walked through how exposing our Kubernetes cluster to the Internet and updating the blog from source code control. Now, in our final step, we’re going to test performance. I have been seeing around 3.5k to 4k requests per second and 200-450mbits/sec of network traffic coming off of this cluster. According to my devtools instance, a request to my blog home page initiates 12 HTTP requests. That would service 291 pageviews a second or 25m pages a day. I think that’s more than I’m going to be popular, but if I get too much traffic, I could always put a CDN in front of it.
To test load, I used hey, which has proven to be a reliable HTTP traffic generator. On homelab.local, which is the VM running Tailscale, I ran:
while true; do hey -z 30s -h2 -c 100 --cpus 4 http://192.168.68.20; done
This runs hey at 100 concurrent threads, using 4 CPUs, hitting the MetalLB IP. We run this for 30 seconds and it prints a report and then the outer while loop starts it over again. hey typical output right now is looking like:
Summary:
  Total:	30.0501 secs
  Slowest:	0.3523 secs
  Fastest:	0.0010 secs
  Average:	0.0278 secs
  Requests/sec:	3584.1162

  Total data:	870240240 bytes
  Size/request:	8080 bytes

Response time histogram:
  0.001 [1]	|
  0.036 [87169]	|■■■■■■■■■■■■■■■■■■■■■■■■■■■■■■■■■■■■■■■■
  0.071 [18927]	|■■■■■■■■■
  0.106 [1260]	|■
  0.142 [233]	|
  0.177 [55]	|
  0.212 [10]	|
  0.247 [25]	|
  0.282 [17]	|
  0.317 [3]	|
  0.352 [3]	|


Latency distribution:
  10% in 0.0138 secs
  25% in 0.0190 secs
  50% in 0.0251 secs
  75% in 0.0330 secs
  90% in 0.0440 secs
  95% in 0.0529 secs
  99% in 0.0790 secs

Details (average, fastest, slowest):
  DNS+dialup:	0.0000 secs, 0.0010 secs, 0.3523 secs
  DNS-lookup:	0.0000 secs, 0.0000 secs, 0.0000 secs
  req write:	0.0003 secs, 0.0000 secs, 0.1145 secs
  resp wait:	0.0183 secs, 0.0005 secs, 0.3522 secs
  resp read:	0.0060 secs, 0.0001 secs, 0.3114 secs

Status code distribution:
  [200]	107703 responses
We’re doing 870240240 bytes in 30 seconds, or 221 megabits/sec:
870240240 bytes / 30 seconds = 29,008,008 bytes/sec
29,008,008 bytes/sec / 1024 bytes in a kilobyte = 28,328.1328125 kilobytes/sec
28,328.1328125 / 1024 bytes in a megabyte = 27.6641921997 megabytes/sec
27.6641921997 megabytes/sec * 8 bits in a byte = = 221.3135375976 megabits/sec
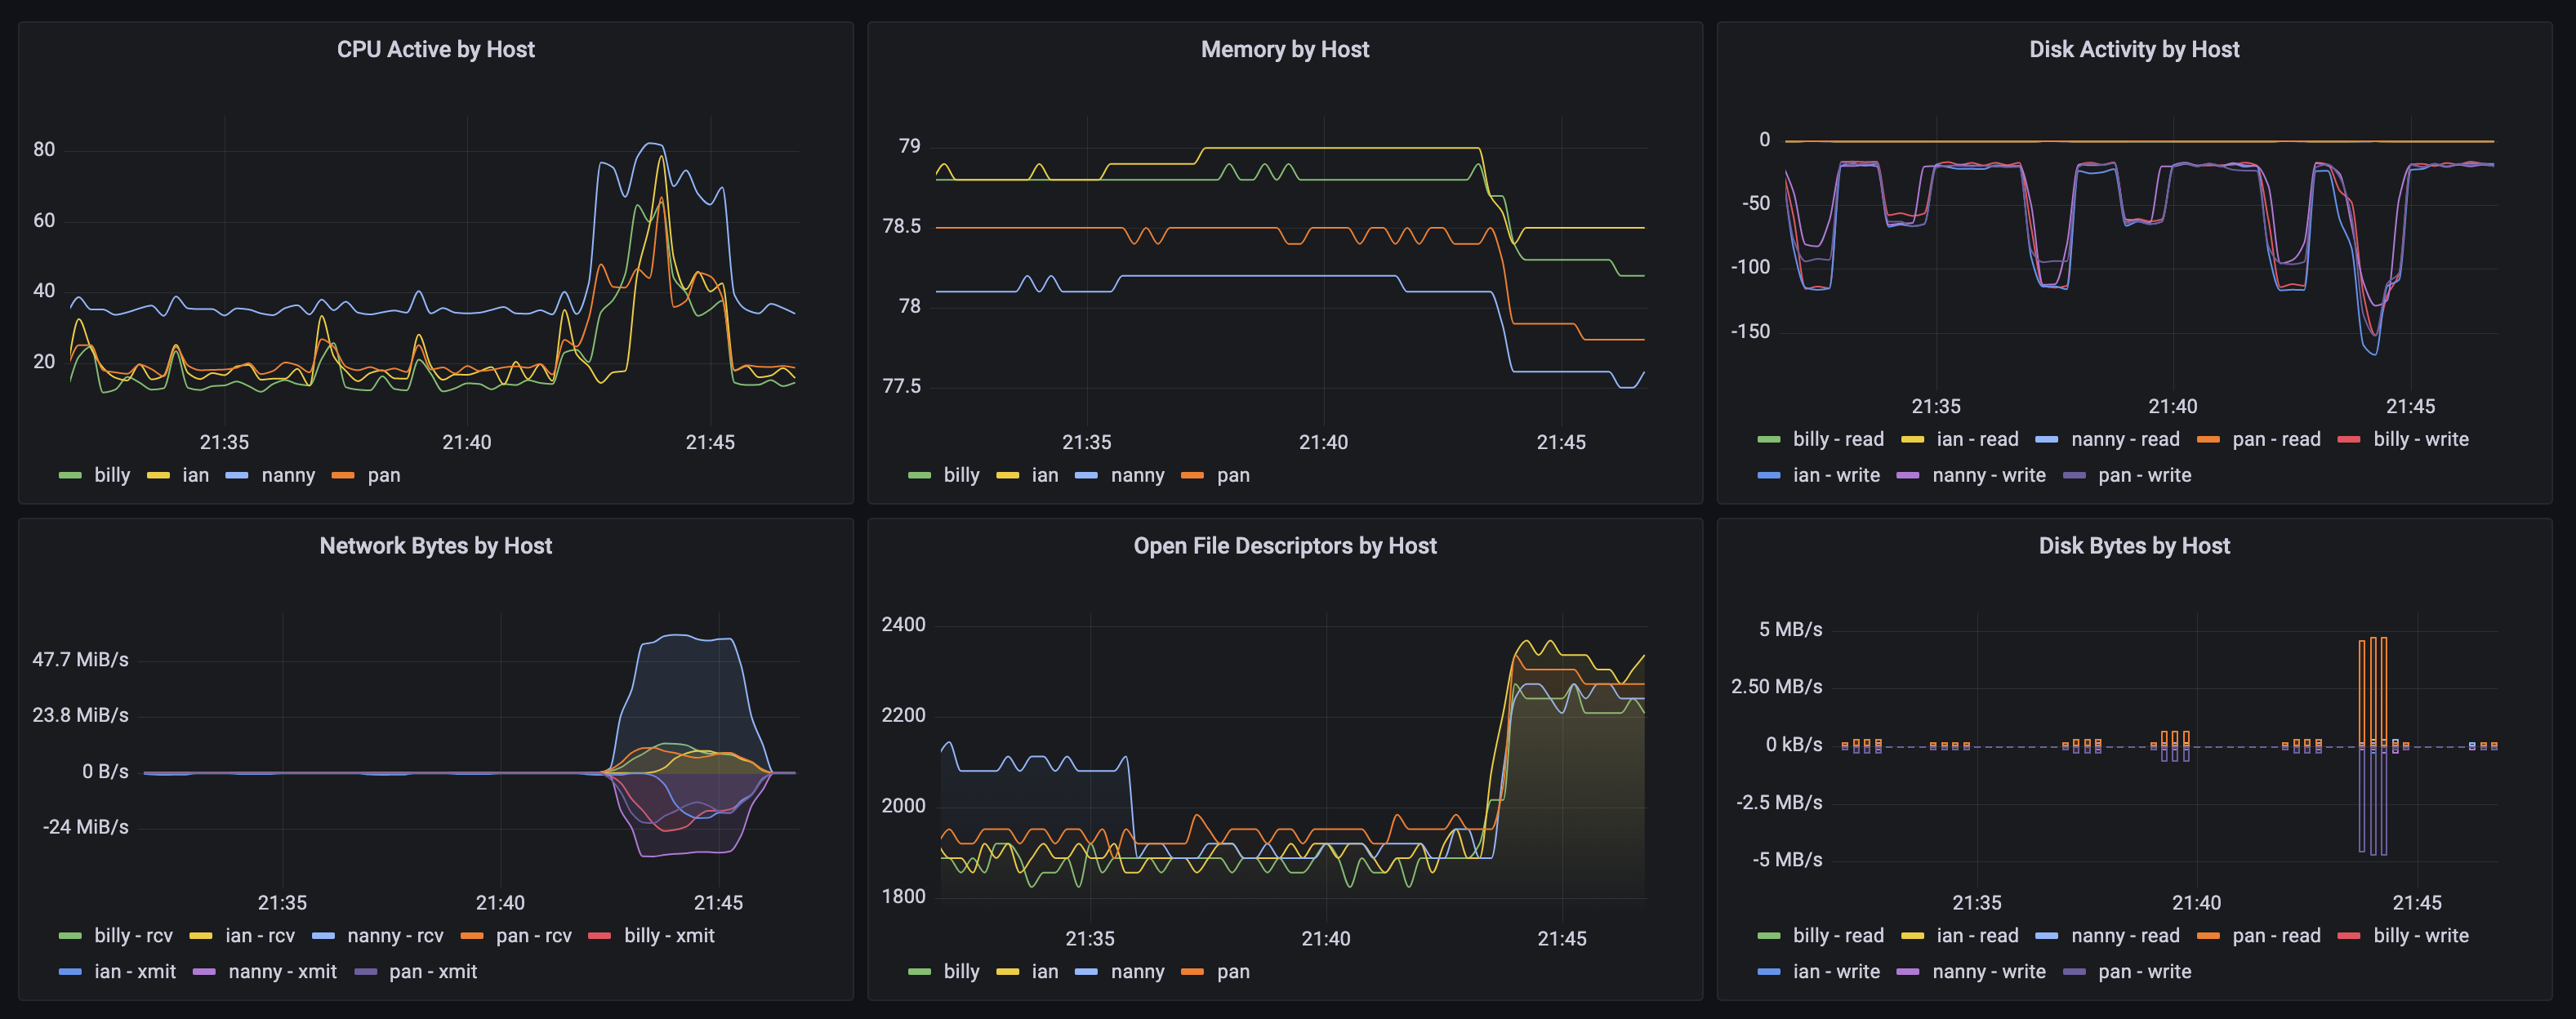
In previous tests, I’ve been able to achieve 400+ megabits a second. Right now, I’m not entirely sure what the limiting factor in my capacity is, but the current capacity feels unlikely to become a constraint from the few people who are going to read it. I’m visualizing these tests in Grafana as well, and it feels like Network somewhere is our limiting factor, or maybe CPU on one of the nodes:
Either way, we’ve built a blog that can perform probably much greater than I need it to, and I’ve built a real workload I can now observe in Grafana (more to come on how we did that later). If you’ve read this far, I hope you to have had an enjoyable time getting back into running some real hardware. We have a redundant, easy to update, web hosting infrastructure for pretty cheap. We’ve learned a number of new technologies on the way, and hopefully, we’ve had fun.
Thanks for reading!
Posts in this Series
- Self-Hosted Blog Part 1 - Overview
- Self-Hosted Blog Part 2 - The Hardware
- Self-Hosted Blog Part 3 - OS & Kubernetes
- Self-Hosted Blog Part 4 - The Blog
- Self-Hosted Blog Part 5 - Container
- Self-Hosted Blog Part 6 - Build
- Self-Hosted Blog Part 7 - Kubernetes
- Self-Hosted Blog Part 8 - Internet Accessibility
- Self-Hosted Blog Part 9 - Performance